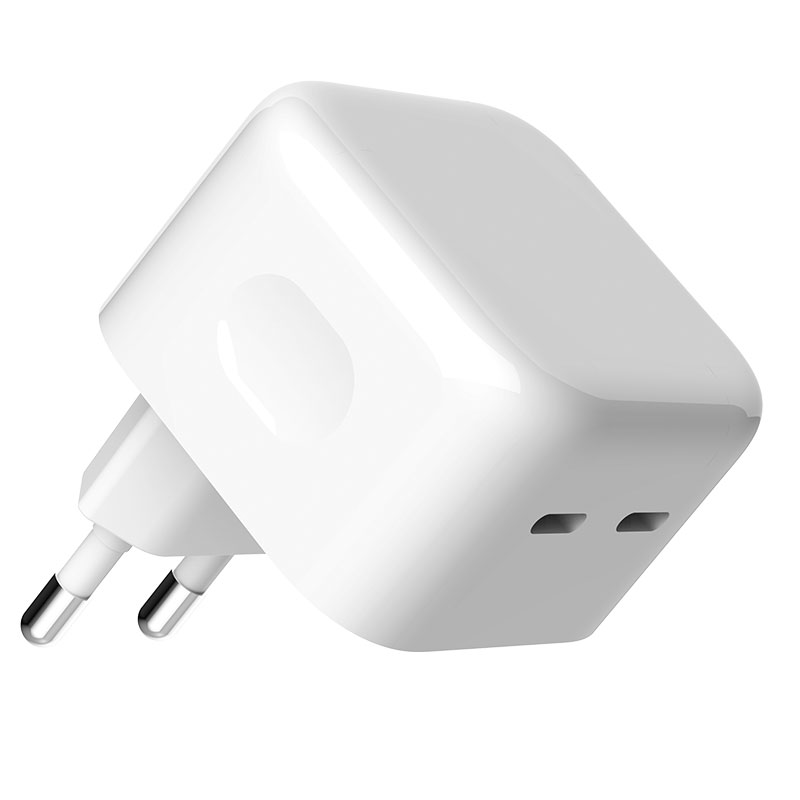
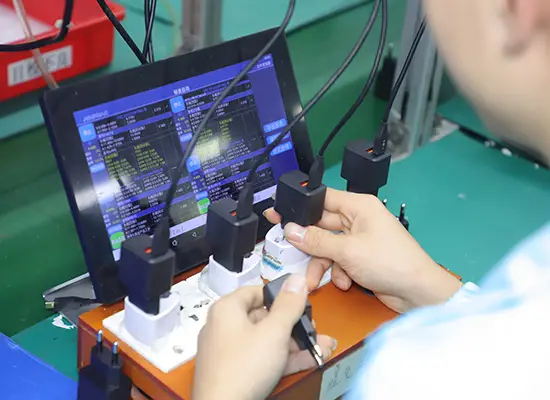
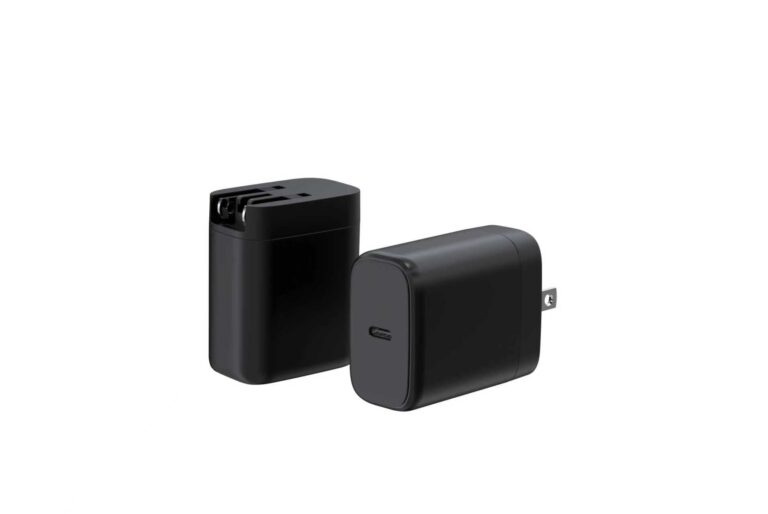
A charger's wattage is its ceiling, not its speed. Real charging follows a curve: full speed early, then a gradual slowdown as the battery fills and heat builds. Understanding that curve is the difference between honest product claims and the "it says 20W but it's slow" complaints that hurt brands.
Why charging speed is not a single number
Phones do not charge at one fixed wattage. They negotiate power with the charger through USB PD, start fast, and taper off to protect the battery. The "20W" on the box is the maximum the charger can deliver — the phone may only use it for part of the session.
The taper exists for a reason: lithium batteries charge fastest at low state-of-charge and resist higher current as voltage climbs, and heat makes both the phone and charger more conservative. The same battery that accepts 30W at 20% state-of-charge may accept only 10W at 80%. This is physics and battery management, not a charger limitation — which is why the charging curve, not the peak, is the honest description of speed.
The four phases of a charging session
A typical session has four phases:
- Negotiation: the phone and charger agree on voltage and current (seconds).
- Constant current / peak: maximum negotiated power while the battery is low.
- Taper: power reduces as voltage climbs and temperature rises.
- Trickle: low power near full, protecting the battery.
The middle two phases decide how long charging takes; the peak phase is short.
Each phase has a different effect on user experience. The negotiation phase is invisible and instant; the constant-current phase delivers most of the early energy and is where wattage differences show; the taper phase protects the battery and stretches the last 20%; and the trickle phase maintains the top few percent. A charger that sustains the peak phase longer delivers a faster 0–60% experience even if its peak is no higher.
What the phone and charger each control
The phone controls how much it requests; the charger controls what it can deliver. A 100W charger on a phone that requests 20W delivers 20W. This is why Apple's fast-charge guidance says "20W or higher" — higher capacity protects the speed, it does not force more current into the phone.
The cable sits between them and can throttle both: a cable with high resistance drops voltage under load, forcing the phone to request less power to stay within its input limits. This is why swapping cables changes the measured curve even with the same phone and charger. When you compare chargers, hold the cable constant and verify it is rated for the negotiated current.
How to read a charging curve chart
A charging curve plots wattage (or current) against time. Read the area under the curve — the total energy delivered — rather than the peak. Two chargers with the same 30W peak can finish differently if one holds 30W longer before tapering.
Reading a curve is about three landmarks: the peak height, the plateau length and the taper slope. The plateau length is the number most buyers ignore — a charger that holds 30W for 20 minutes beats one that peaks at 35W for 5 minutes. The taper slope tells you how the design manages heat; a gentle taper indicates good thermal design, a cliff indicates the charger or phone is backing off hard.
Why '50% in 30 minutes' is the honest metric
Because charging is fastest in the first half, "50% in 30 minutes" reflects real user value: a meaningful top-up on the go. It also sidesteps the misleading peak-wattage race. Use it in marketing instead of "30W fast charge."
Using curves to compare chargers fairly
Compare chargers by the energy delivered in a fixed window (e.g., % charge in 30 minutes at a defined ambient), not by the label wattage. The same test protocol applies to iPhone charging tests — conditions must match for numbers to be comparable.
Typical charging curves for popular phones
Recent iPhones reach roughly 50% in 30 minutes with a 20W+ adapter, and newer Android flagships with PPS-capable chargers deliver large top-ups in the same window. Exact curves vary by model, temperature and cable.
Across brands, the first-30-minute story is remarkably consistent: most modern phones reach 40–60% in 30 minutes with a correctly matched charger, then slow through the taper. The differences appear in the details — iPhones taper conservatively, some Androids sustain high power longer, and battery temperature reshapes every curve. Publishing your measured curve for each target phone is the most credible spec a brand can offer.
How temperature affects the curve
Heat is the enemy of fast charging: phones taper earlier when hot, and chargers may derate in warm rooms. A charger with good thermal design holds its output longer — which is why "holds 30W for 20 minutes" beats "peaks at 35W for 5 minutes" in real use.
Charging in a hot car or on a bed that blocks airflow raises battery temperature, and the phone responds by tapering earlier and harder. Charger design matters here too: a charger with good thermal design holds its output longer at high ambient, which shows up as a flatter curve in the first 30 minutes. The practical test is a warm-room comparison, not a lab at 21°C.
Reading vendor charts correctly
Check the fine print: which phone, which ambient, which state of charge, and whether the curve was measured or simulated. A chart without conditions is decoration.
Vendor charts are marketing documents with engineering data inside, and the engineering is only as good as the conditions stated. Check four things before accepting any chart: the phone model and firmware, the starting battery level, the ambient temperature, and whether the curve was measured or simulated. A curve measured on a flagship at 21°C from 0% tells you nothing about a mid-range phone in a 32°C room. Also ask whether the chart shows input power or output power — some vendors plot the wall draw, which includes conversion losses and looks higher than what reaches the battery. When a chart lacks any of these conditions, treat the numbers as directional, not comparative. The discipline of checking conditions is the same one that separates credible charging reviews from marketing fluff.
Why '50% in 30 minutes' is a reliable metric
It is measurable, repeatable and user-relevant. It works across wattages (a 20W phone charger and a 100W laptop charger both have a 30-minute story), and it is hard to fake when the conditions are stated.
Using curves in honest comparisons
When your content team compares chargers, publish the curve and the conditions. Buyers who understand the curve trust the brand that shows it — and a GaN charger lineup with honest sustained-output specs built on per-batch test data sells itself to informed users.
The most honest product-page metric is a stated test: "device X, cable Y, 25°C ambient, 5% to 80% in N minutes." Add the first-30-minute gain as the headline number and the full curve as supporting evidence. Buyers who see the curve trust the brand; buyers who see only a peak wattage learn to be skeptical of every spec sheet in the category.
FAQ
Why does phone charging slow down over time?
To protect the battery: as charge level rises and temperature builds, the phone requests less power to reduce stress. The taper is intentional, not a charger failure.
Is a 20W charger always 20W?
No. 20W is the maximum it can deliver; the phone negotiates what it needs, and both taper power as the session progresses.
What does "50% in 30 minutes" mean?
It means the phone reaches 50% battery from a low state in 30 minutes — a user-relevant measure of real charging speed that reflects the whole curve, not just the peak.
How should I compare two chargers fairly?
Use the same phone, cable, ambient temperature and starting battery level, and measure charge gained in a fixed window. Label wattage alone is not comparable.
Want honest, verifiable charging specs for your product pages? Send your lineup to our team through the contact page — we share measured charging curves and test conditions for our GaN chargers.
This article is part of Phone Chargers, the guide that covers this topic in decision order.