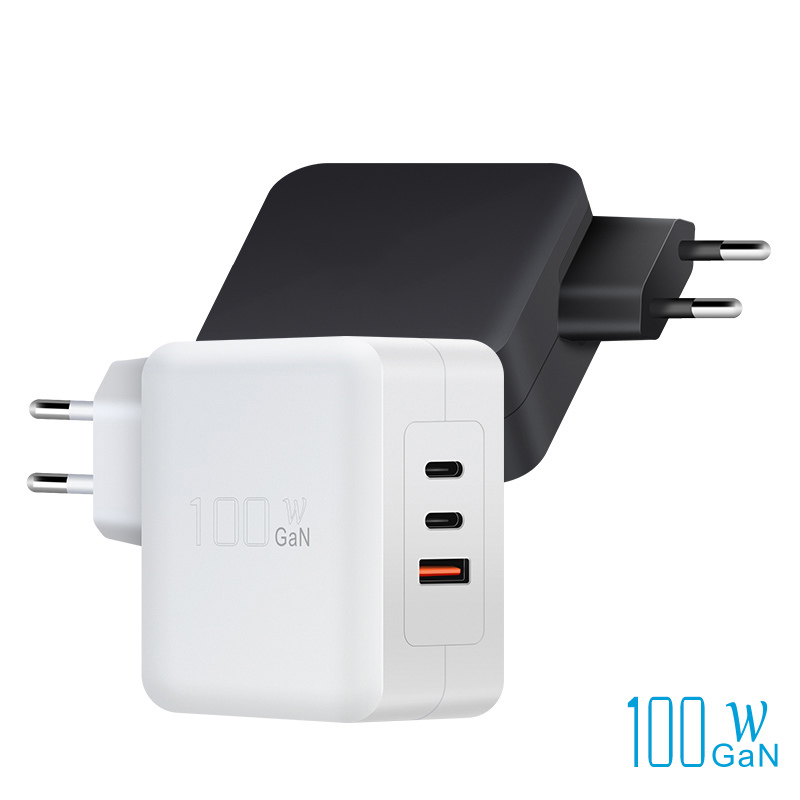
The cheapest laptop charger is rarely the cheapest to own. Total cost of ownership adds energy consumption, spare inventory, warranty replacements and support time — costs that quietly exceed the unit price across a fleet. This guide builds the TCO model procurement teams can defend to finance.
Why charger TCO is more than unit price
The unit price is the visible cost; everything else is spread across three years. Energy draw (active and standby) repeats daily, spares are bought in advance and written off if unused, warranty replacements carry freight and labor, and support time is the most expensive hidden line. A slightly pricier charger with better efficiency and a longer warranty can beat a cheap one on total cost within the first year of a large fleet.
Energy consumption and efficiency over three years
Charger energy has two parts: active-mode efficiency (output ÷ input during charging) and standby draw (the constant idle load while plugged in). DOE external power supply standards and ENERGY STAR cap standby and set minimum efficiency, which makes certification a TCO signal. A charger drawing 0.1W vs 0.3W standby across 1,000 fleet units and 365 days is a real electricity line, not trivia.
The energy line compounds quietly: active efficiency determines how much of the wall draw reaches the laptop, and standby determines the always-on cost. A charger at 88% versus 92% efficiency wastes the difference as heat on every session, and the DOE external power supply standards exist precisely to cap that waste. For a fleet, the efficiency difference between two SKUs is a line item in the TCO model, not a technical footnote — which is why procurement should request the measured efficiency curve, not just the wattage.
Inventory and spares planning
Spares planning is the counterintuitive part of charger TCO: buying too few creates downtime and emergency freight; buying too many ties up capital in items that obsolesce with the laptop. The standard model holds 5–10% spares for a 3-year fleet lifecycle, with a reorder trigger. Each spare SKU also carries storage and tracking cost, which is why standardization shrinks the inventory line directly.
Spares planning deserves its own math because it is the line most finance teams miss: the spare pool is capital sitting in storage, and its write-off risk grows with every laptop refresh. The standard model — 5–10% spares with a reorder trigger — assumes a predictable failure curve, which certified chargers with documented test data actually have. Uncertified chargers fail erratically, which forces larger safety stock and more emergency freight. Standardizing on one SKU per laptop class shrinks the pool, and the documentation that comes with certified supply — batch traceability, warranty terms — lets procurement plan the pool instead of guessing.
Warranty and replacement costs
Warranty cost is failure rate × replacement cost × claim handling. A charger with a 2-year warranty and documented test data has a predictable claim curve; a no-name charger's curve is a guess. Claim handling adds freight, labor and user downtime. Fleets should track claims by SKU and re-qualify any model with an elevated rate — the data, not the warranty sticker, is the TCO input.
The warranty math rewards documented suppliers: a charger with per-batch test data and a structured claim process produces predictable replacement costs, while an unbranded SKU turns every failure into an investigation. Fleet buyers should ask suppliers for claim-rate history and the replacement workflow before signing. The quality-control documentation that backs a charger SKU is the same evidence an insurer and a finance team will ask for — keep it with the purchase record.
Standardization as a cost lever
Standardization attacks every line at once: one charger tier per laptop class reduces spares variety, one cable spec simplifies stock, and one certification set streamlines procurement. The trade-off is that a standard charger may be slightly oversized for some users — but the savings in inventory and support dwarf the few watts of over-provisioning.
Building a TCO model for your fleet
The model has four inputs per SKU: unit price, efficiency and standby (energy cost), spares quantity and write-off, and warranty claim rate with handling cost. Run the model over 3 years at the fleet size, and compare SKUs on total cost, not price. A spreadsheet version with the formulas visible lets finance audit the assumptions, which is the difference between a model and a decision. The output is a defensible number finance can sign off.
The model is only as good as its assumptions, so document each input's source: unit price from the quote, efficiency and standby from the energy label, spares from the fleet lifecycle, and claims from supplier data or your own history. Run the model across three SKUs — budget, standard and premium — and the 3-year totals will surprise most teams: the premium SKU often wins once energy, spares and support are counted. Present the model with the input table visible, so stakeholders can challenge the assumptions rather than the conclusion. Our OEM/ODM program can supply the efficiency, standby and warranty data to feed the model.
TCO model inputs explained
The inputs map to real documents: unit price from the quote, efficiency and standby from the energy label or test report, spares from the fleet lifecycle plan, and claim rates from the supplier's warranty data or your own history. Where data is missing, model a range — the range itself is a procurement question to ask suppliers.
Energy cost calculations
The energy math per charger: active hours × active wattage × hours per day × days per year × electricity rate, plus 24-hour standby draw. For a fleet, multiply by unit count. At 500 chargers, 0.2W standby and $0.15/kWh, standby alone is roughly $130/year — small per unit, real at fleet scale, and avoidable with a Level VI or CoC Tier 2 charger.
Spares and warranty math
Spares: target stock × unit cost × write-off risk (spares not consumed by lifecycle end). Warranty: fleet size × annual claim rate × (replacement unit + freight + 30–60 minutes of IT time per claim). The claim rate is the leverage point — a 2% vs 5% annual claim rate changes the TCO more than the unit price difference between most SKUs.
Standardization savings
Quantify standardization by comparing the multi-SKU baseline against the single-SKU plan: reduced spares stock, one support document, one procurement contract, and fewer compatibility questions. Even a 10% reduction in spares and support across a 3-year cycle usually exceeds the unit price difference that made the mixed-SKU plan look cheaper.
Presenting the TCO to stakeholders
Present the model as a table with three scenarios (budget SKU, standard SKU, premium SKU) and three cost lines (energy, spares, warranty/support) plus the unit price. Show the 3-year total per unit and per fleet, and highlight the break-even point where the higher-priced SKU becomes cheaper. Finance understands lifecycle cost; the model gives them the numbers.
FAQ
How do I calculate laptop charger total cost of ownership?
Sum unit price, 3-year energy cost (active + standby), spares cost and write-off, and warranty claims with handling. Compare SKUs on the total, not the price.
Does charger standby power really matter for a fleet?
Yes — standby runs 24/7 across every unit. A 0.1W difference across a large fleet is a measurable annual electricity cost, and efficiency standards cap it.
How many spare chargers should a fleet keep?
Typically 5–10% of fleet size for a 3-year lifecycle, with a reorder trigger. Standardizing on one SKU reduces the spare burden directly, and the reorder trigger plus write-off rule belong in the same document.
Is a cheaper charger ever the better TCO choice?
Sometimes, but only when efficiency, claim rate and warranty are comparable. Run the model; if the cheap SKU's energy, spares and support costs exceed the premium SKU's price difference, the premium SKU wins on total cost.
Building a fleet charger TCO model? Send your fleet size and laptop mix to our team through the contact page — we can provide efficiency, standby and warranty data to feed the model.
This article is part of Laptop Charger OEM & Fleet Programs, the guide that covers this topic in decision order.